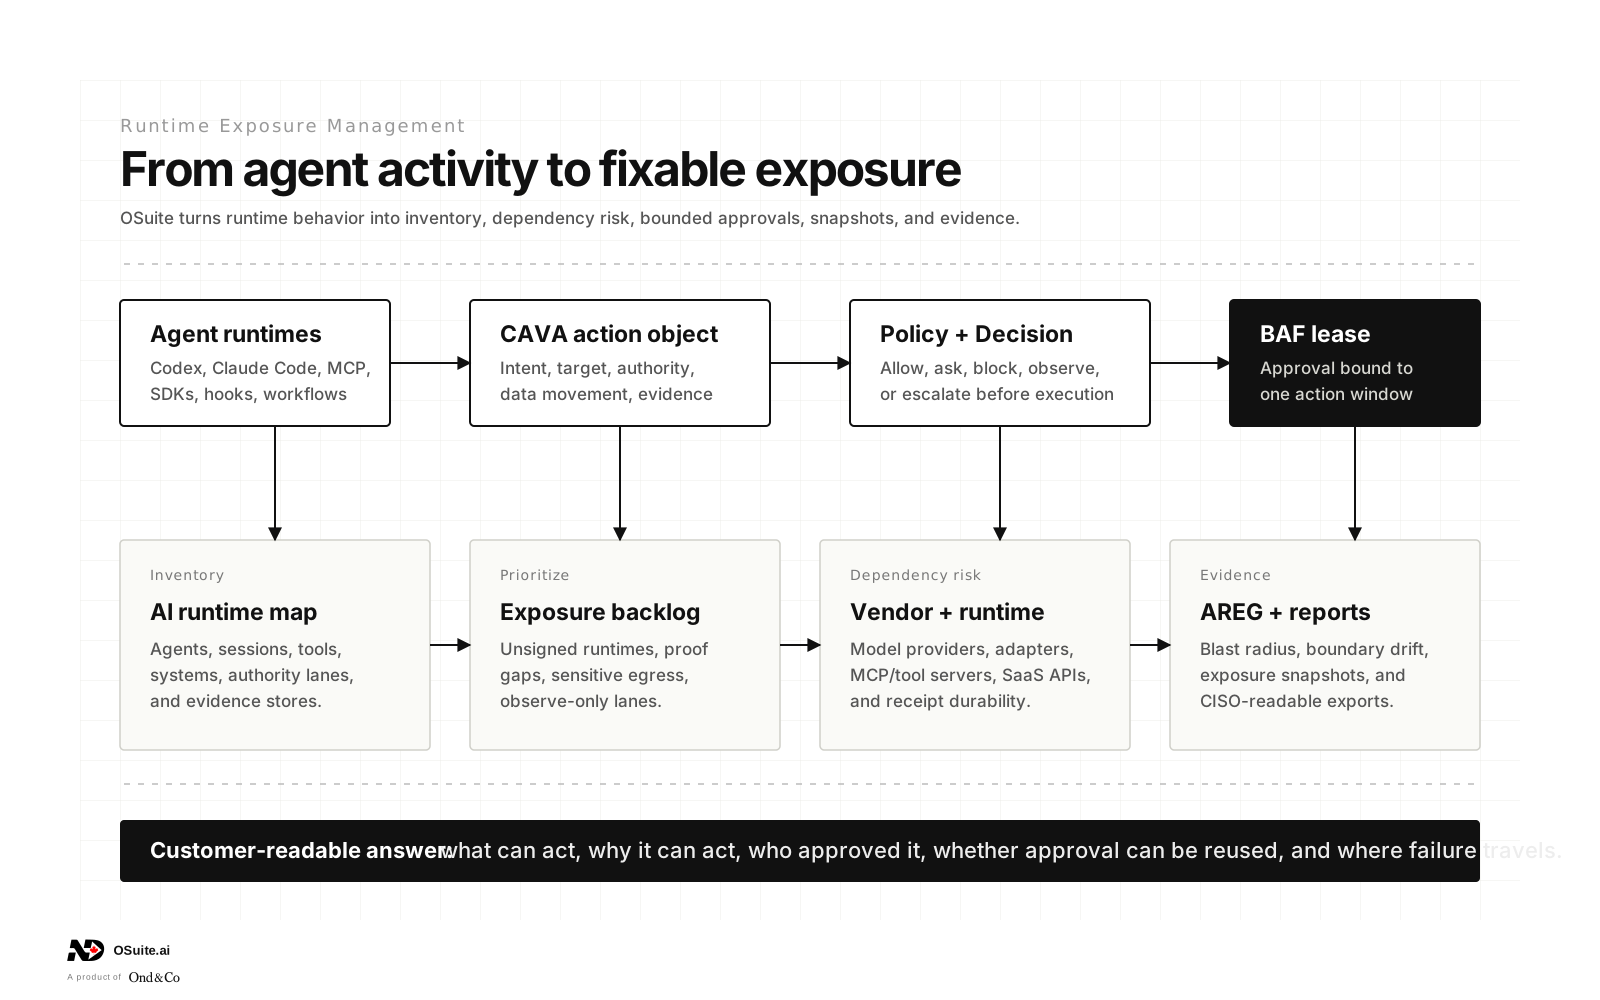
Dashboards summarize activity; AREG models relationships that determine blast radius.
Runtime exposure is about where risk can travel, not just how many actions were allowed or blocked.
OSuite uses AREG to show agents, tools, systems, boundaries, leases, and proof gaps as one security surface.
Agent products love dashboards.
Counts, charts, statuses, colored badges, approval queues, risk scores, action totals, blocked events, model usage, token spend. All useful. None of them automatically answer the question a CISO asks when agents start spreading through the organization:
Where can this thing reach?
That question is why OSuite built AREG, the Agent Runtime Exposure Graph.
A dashboard shows what happened. AREG shows how risk can travel.
Runtime exposure management
Metrics flatten the thing security cares about
Suppose two agents each executed 100 actions this week.
Agent A read public documentation, summarized internal notes, and wrote draft files in a sandbox.
Agent B touched a CRM, read support tickets, opened pull requests, posted partner-facing messages, and triggered workflow automations that can update customer records.
A dashboard may show both as active agents with similar event counts. Security does not care that the counts match. Security cares that the blast radius does not.
Exposure is relational. It depends on what the agent can reach, which runtime lane it uses, what tools it can call, which systems are downstream, what boundaries are crossed, which approvals are reusable, and where proof is missing.
You cannot see that from a list of rows alone.
AREG is a graph because the risk is a graph
Agents do not create risk in isolation. They create risk through connections.
An agent connects to a runtime. The runtime connects to a tool. The tool connects to a system. The system touches a business process. The process affects customers, money, production, legal obligations, or external trust. The action has an approval route. The approval has a lease. The lease has a boundary. The outcome has proof or a gap.
That is not a chart problem. It is a graph problem.
Repository, CRM, database, cloud resource, SaaS object, messaging channel, or support queue.
Boundary
Production, customer data, money, external communication, privilege, or regulated workflow.
Action
The CAVA canonical action object.
Lease
The BAF approval boundary and expiry.
Proof
The PCAA evidence trail and closure state.
Once those pieces are connected, OSuite can explain exposure in human language: which agents have the largest blast radius, which runtime lanes are unverified, which actions cross customer-data boundaries, and which approvals are too reusable.
A dashboard can be green while the graph is ugly
This is the painful part.
A dashboard can look healthy while the runtime security shape is bad.
Maybe there were few blocked actions because policy is too permissive. Maybe approvals look fast because leases are being reused too broadly. Maybe no incidents were recorded because the agent runtime is unsigned. Maybe all actions closed successfully because the product only measures technical success, not governance closure.
Green is not proof.
AREG forces the product to show structure, not just sentiment. It can say:
—This agent is connected to three high-impact systems.
—This runtime lane is not signature-verified.
—This tool crosses an external communication boundary.
—This approval lease can be reused across too broad a target scope.
—This system lacks proof closure for recent actions.
—This agent should not be expanded until its exposure backlog is resolved.
That is a different kind of product experience. It is less flattering, but more useful.
Why this helps before an incident
Many security products become valuable after something goes wrong. Runtime exposure should be useful before that.
AREG gives teams a way to ask rollout questions:
—Which agents are safe to expand?
—Which ones need tighter policy posture?
—Where should we require approval?
—Which systems should not be reachable from this runtime?
—Which proof gaps should be fixed before the next pilot?
—Which agent has too much combined access for its business purpose?
Those are deployment questions, not forensic questions.
The best time to understand blast radius is before the agent proves it for you.
Why this matters during procurement
Enterprise buyers are tired of AI demos that only show capability.
Capability is not enough. In a downturn or after the first major agent incident, buyers will ask for survivability: what happens when the agent is wrong, compromised, overconfident, poorly instructed, or connected to the wrong system?
A dashboard answers with activity. AREG answers with exposure.
The difference matters because governance is not simply "did the agent do something bad?" Governance is also "could it have done something worse, and why did the organization allow that path to exist?"
What OSuite should show customers
The product version of AREG should not feel like a research paper.
Customers should see:
—runtime security score;
—top blast-radius agents;
—unverified runtime lanes;
—approval-bound actions;
—proof gaps;
—exposure backlog;
—exportable Markdown or PDF evidence;
—a runtime map that shows where agent consequence can travel.
The graph can be complex under the hood. The buyer-facing output should be plain.
"This agent can reach customer data through an unsigned workflow lane, and three recent approval leases are too broad."
That is a sentence a security lead can act on.
The practical answer
If a buyer says, "We already have dashboards," the answer is:
Good. Keep them.
But dashboards summarize activity. AREG maps exposure.
If the customer wants to know how many actions happened, a dashboard is enough. If they want to know where agent risk can travel, which boundaries are weak, and what proof is missing before rollout expands, they need a runtime exposure graph.
That is the difference between watching agents and governing them.